Note
Click here to download the full example code
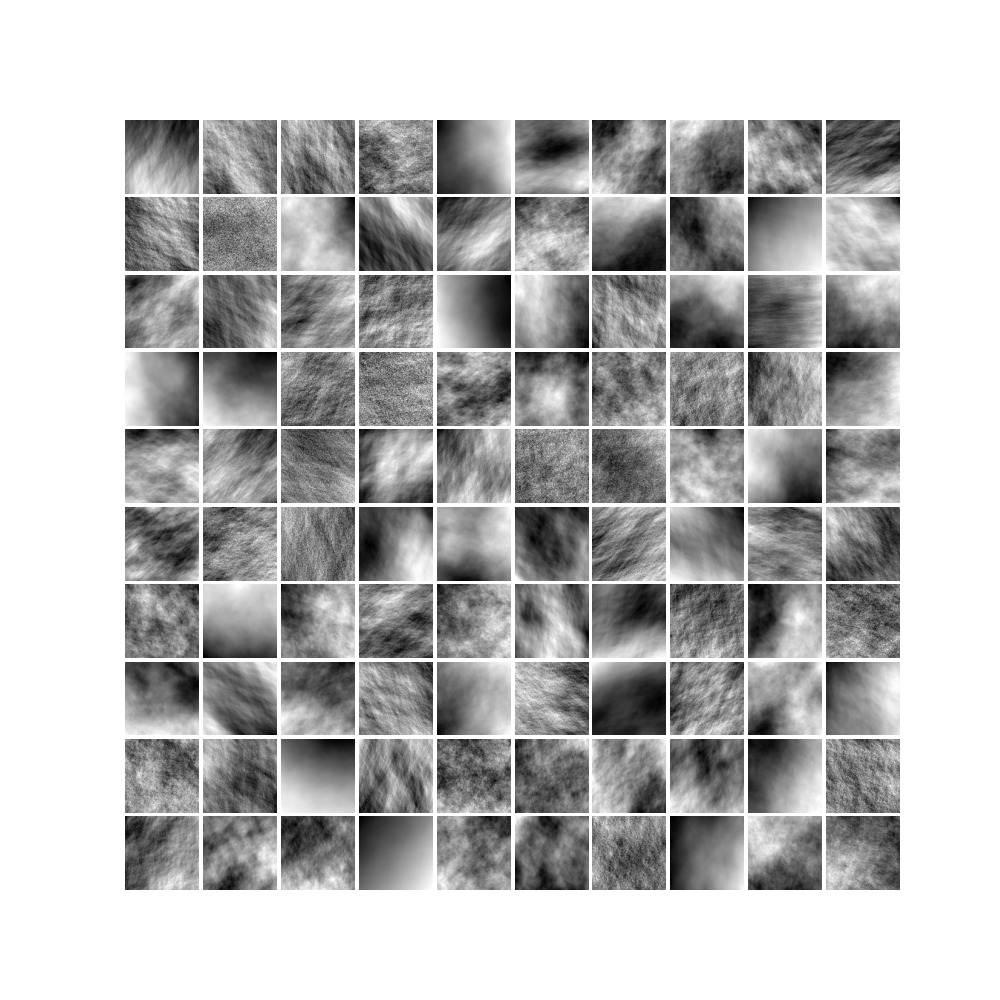
Texture Patchwork
Code author: Frédéric Richard <frederic.richard_at_univ-amu.fr>
This example shows how to build a series of simulations of a field model by changing its parameter values at random. This is useful to construct a dataset of textures.
from matplotlib import pyplot as plt
import matplotlib.gridspec as gridspec


import numpy as np

from afbf import tbfield, coordinates

ncols = 10
nrows = 10
nbexamples = ncols * nrows  # Number of examples.
N = 100  # Size of examples.

# Mode of simulation for step values (alt, 'unif', 'unifmax', or 'unifrange').
simstep = 'unifmin'
# Mode of simulation for step interval bounds (alt, 'nonunif').
simbounds = 'unif'

# Define the field to be simulated and coordinates where to simulate.
field = tbfield('afbf-smooth')
coord = coordinates(N)

# Set the mode of simulation for the Hurst function.
field.hurst.SetStepSampleMode(mode_cst=simstep, mode_int=simbounds)

# Prepare the figure
fig = plt.figure(figsize=(nrows, ncols))
gs = gridspec.GridSpec(nrows, ncols)
gs.update(wspace=0.05, hspace=0.05)  # Set axe spacing.

# Generate several examples.
for example in range(nbexamples):
    # Sample new model parameters.
    np.random.seed(example)
    field.hurst.ChangeParameters()
    field.topo.ChangeParameters()
    # Uncomment to show field parameters.
    # field.DisplayParameters()

    # Compute field features.
    field.ComputeFeatures()
    # Uncomment to show some field features.
    # print('Hurst index:', field.H)
    # print('Std deviation (hurst):', field.aniso_indices_hurst[0])
    # print('TV-norm (hurst):', field.aniso_sharpness_hurst[0])

    # Simulate an example with the current model.
    np.random.seed(example)
    field.EvaluateTurningBandParameters()
    simu = field.Simulate(coord)
    # Uncomment to display the field simulation.
    # simu.Display(2)

    # To handle simu as an ndarray of numpy, set
    image = np.reshape(simu.values, simu.M)
    # To further display it with pyplot of matplotlib:
    i = int(np.floor(example / ncols))
    j = int(example - i * ncols)
    ax = plt.subplot(gs[i, j])
    ax.imshow(image, cmap='gray')
    ax.set_axis_off()

plt.show()
Total running time of the script: ( 2 minutes 15.834 seconds)